Unlocking Visual Storytelling with the Infographic Elements Icons Set
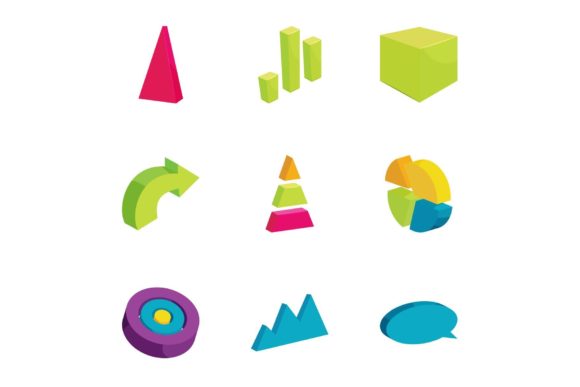
In the fast-paced digital landscape, the ability to communicate complex ideas quickly and effectively is a superpower. Whether you are a business owner presenting quarterly results, a content creator explaining a new trend, or a student organizing research data, the visual component of your message often carries more weight than the text itself. This is where the Infographic Elements Icons Set becomes an indispensable tool for modern creators. By leveraging a curated collection of 16 cartoon illustration vector icons, users can transform dry statistics into engaging narratives that capture attention and retain interest.
The core value of this specific icon set lies in its versatility and accessibility. Designed specifically for web use, these elements bridge the gap between professional data visualization and approachable, friendly design. The inclusion of multiple file formats—JPG, EPS, AI, PSD, and PNG—ensures that regardless of your technical skill level or the software you prefer, you have the right tools to execute your vision without friction.
The Power of Cartoon-Style Data Visualization
Traditional infographics often lean heavily on rigid geometric shapes and sterile corporate aesthetics. While effective in certain contexts, this style can sometimes feel cold or intimidating to a general audience. The Infographic Elements Icons Set takes a different approach by utilizing a cartoon illustration style. This aesthetic choice is strategic; it humanizes data.
When viewers see hand-drawn lines, playful shapes, and vibrant colors, they are more likely to lower their guard and engage with the content. This style suggests approachability and creativity, making it ideal for topics that might otherwise feel dense or boring. For instance, explaining a complex healthcare process or a financial budget becomes significantly easier when accompanied by friendly, illustrative icons rather than stark bar charts.
Furthermore, the cartoon style allows for greater flexibility in branding. Because the illustrations are not tied to a specific corporate identity, they can be easily adapted to fit various brand voices, from quirky startups to educational platforms. The 16 unique icons included in this set cover a broad spectrum of common infographic needs, such as growth indicators, communication symbols, user demographics, and timeline markers.
Understanding the File Formats: A Practical Guide
One of the most significant strengths of the Infographic Elements Icons Set is the comprehensive range of file formats provided. Understanding how to utilize each format can maximize the utility of these assets in your projects.
- AI (Adobe Illustrator): This is the native vector format. It is essential for designers who need to edit the paths, change colors, or resize the icons without any loss of quality. Since these are vector graphics, they can be scaled from a tiny mobile icon to a massive billboard without becoming pixelated.
- EPS (Encapsulated PostScript): Similar to AI, this is a universal vector format compatible with many design programs beyond Adobe, such as CorelDRAW or Inkscape. It is the go-to choice for print professionals who require high-resolution scalability.
- PSD (Photoshop Document): For users who work primarily in raster-based environments, the PSD files offer layered flexibility. You can apply textures, shadows, and blending modes directly within Photoshop while maintaining the integrity of the original design.
- PNG (Portable Network Graphics): This is the workhorse for web development. PNGs support transparency, meaning you can place these icons over any background color or image without unsightly white boxes appearing around them. They are optimized for screen display.
- JPG (Joint Photographic Experts Group): While less flexible due to the lack of transparency, JPGs are useful for quick previews or for embedding in documents where file size is a critical constraint and transparency is not required.
Having access to all these formats means you are never locked out of a project due to software incompatibility. It empowers teams with mixed skill sets to collaborate effectively; a developer can grab the PNGs for the website, while a graphic designer uses the AI files to create a printed brochure.
Real-World Applications and Use Cases
The utility of the Infographic elements icons set extends far beyond simple decoration. These elements serve as functional building blocks for storytelling. Consider the following scenarios where these icons can elevate a project:
- Educational Content: Teachers and e-learning developers can use these icons to break down lesson plans into digestible visual steps. A history timeline or a science process flow becomes much clearer when supported by consistent, thematic imagery.
- Marketing Presentations: When pitching to investors or clients, keeping the audience engaged is crucial. Using these cartoon icons to highlight key metrics—such as user growth or revenue streams—can make a slide deck feel dynamic and memorable.
- Social Media Graphics: In the scroll-heavy world of Instagram and LinkedIn, visuals stop the thumb. Creating carousel posts that explain a "How-To" guide using these 16 distinct icons can significantly boost engagement rates compared to text-only posts.
- Internal Reporting: Even internal company newsletters benefit from visual flair. Using friendly icons to represent department goals or employee satisfaction surveys can foster a more positive company culture.
Evaluating Suitability for Your Project
While the Infographic Elements Icons Set offers immense value, it is important to evaluate whether it aligns with your specific project requirements. The cartoon illustration style is a defining characteristic; if your brand guidelines strictly mandate a hyper-realistic or minimalist flat design, these icons might require significant modification to fit.
However, for projects aiming to connect emotionally with an audience, this set is often the superior choice. The limitations are minimal, primarily revolving around the specific artistic style. There are 16 elements, which is a robust number for a single set, but large-scale data projects requiring hundreds of unique data points might need to supplement this set with additional custom graphics.
It is also worth noting the advantage of the vector nature of the files. Unlike raster images that degrade when enlarged, these vectors ensure that your infographics look crisp on high-DPI screens, such as Retina displays and modern smartphones. This future-proofs your content, ensuring it remains professional as display technologies evolve.
Maximizing Impact with Strategic Design
To get the most out of the Infographic Elements Icons Set, consider the principles of visual hierarchy. Do not simply scatter icons across a page; use them to guide the viewer's eye. Use the larger, more complex icons to denote main sections, and the simpler elements to support secondary information.
Color consistency is another key factor. Although the set comes with pre-defined colors, the editable nature of the AI and EPS files allows you to swap these hues to match your brand palette perfectly. This small adjustment can make a generic template feel like a bespoke creation tailored specifically for your organization.
Moreover, remember that whitespace is your friend. Even the most charming cartoon icons can become overwhelming if crammed together. Allow each element from the set to breathe, giving the viewer time to process the information associated with each graphic.
Conclusion: A Versatile Asset for Modern Creators
In conclusion, the Infographic Elements Icons Set represents a practical, high-value resource for anyone looking to enhance their visual communication. By combining the warmth of cartoon illustrations with the technical robustness of vector formats like AI, EPS, and SVG-compatible PNGs, it solves many of the common pain points faced by designers and non-designers alike.
Whether you are crafting a detailed report, designing a landing page, or creating social media content, these 16 elements provide a solid foundation for storytelling. They remind us that data does not have to be dry and that information design can be both functional and delightful. As the demand for visual content continues to rise, having a reliable, flexible, and engaging icon set in your toolkit is not just an advantage—it is a necessity for effective communication in the digital age.